Two surprising secrets of winning in-house creative teams
ANA's In-House Agency Fact Book reveals insights on capabilities and structures. Award winners have fewer managers and more makers, and reward focus even over "doing all the things."


Everyone has probably already seen ANA’s IN-HOUSE AGENCY FACT BOOK from January of last year. It’s a fabulous document, chock-full of facts and figures about 33 different in-house teams, from Chobani to Land O'Lakes, Inc., and American Express to JPMorgan Chase & Co..
Each in-house agency declared things like “Core Capabilities,” and listed their FTE/Freelance breakdown, number of projects, billing method, etc. 10 agencies even sent through their org chart.
We were curious to see which capabilities got the most investment, and if there were any differences between ANA In-House Agency Award winners and the rest of the agencies.
First off: some general reflections on the respondents.
Some in-house agencies are, uh… overwhelmingly productive
A few of us on the team have run agencies/professional services firms in the past, and we were amazed at the number of projects that some of these agencies take on per annum. On average, the agencies surveyed have around 50 employees, and take on more than 4,900 projects per year. That’s close to 100 projects per person! Even if we remove the two outliers in the set – which produce 45,000 and 31,000 projects per year with 100 and 50 people, respectively – the average is still over 2,600 projects per year.
A reflection: even with freelance help, the sheer amount of effort that must go into tracking, measurement, process improvement, and resourcing must be monumental. The size and scope of each project will of course vary for each agency, but even the counting and tracking of thousands of projects suggests that many of these agencies are brought in at the last second on highly functional, tactical briefs.
Seven brilliant basics
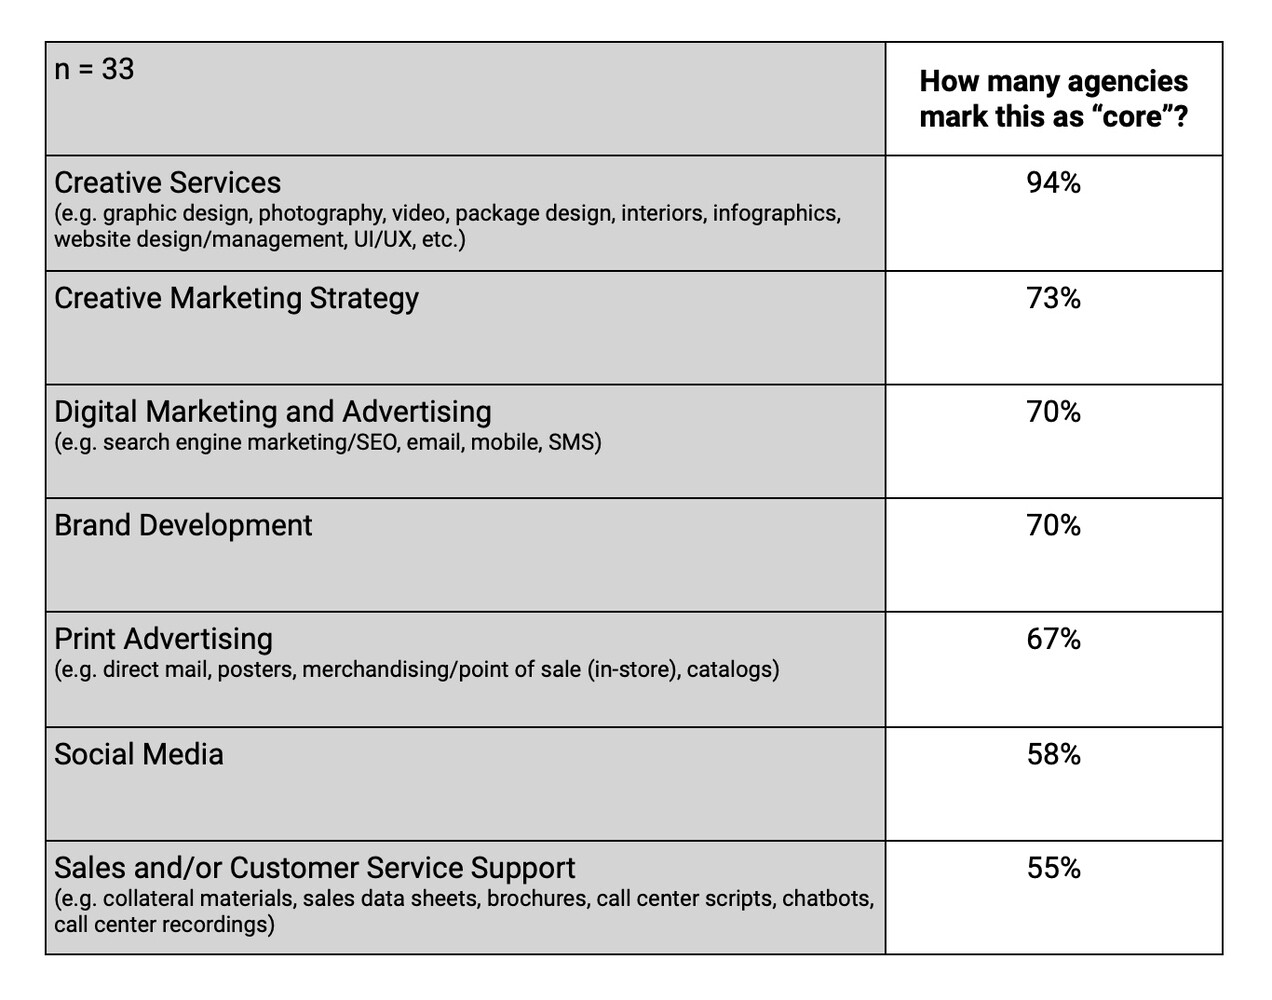
Here’s what everyone is up to: mostly Creative production, regardless of medium or recipient. Creative Marketing Strategy and Brand Development strike us as too loosely defined to be useful in this context; is the former about briefing, and is the latter about activation?
And if creative services, digital marketing, and social media pop for most agencies, why is Content Marketing Strategy/Management excluded? (See below.)
Six nice-to-haves
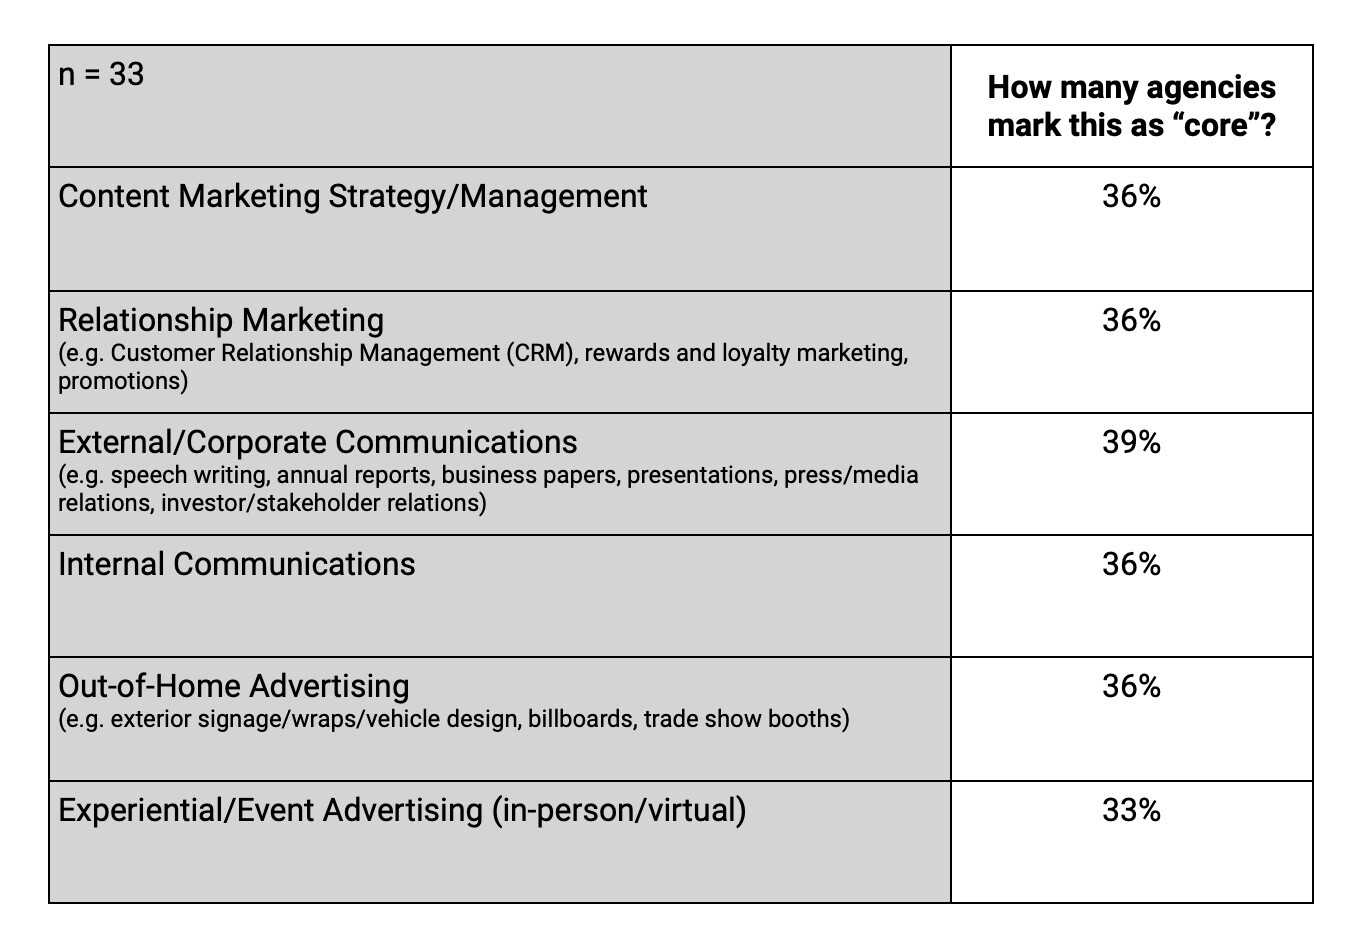
Everything Else
In order from most frequent to least, fewer than one-third of agencies flag the following as “core capabilities”: Animation; Digital Strategy; Televised Commercials; Marketing Analytics and Research; E-Commerce (e.g. platform, product content, UI/UX); Media Planning/Buying; Podcasting; Programmatic Media Buying; Influencer Marketing; Radio Commercials; Augmented Reality/Virtual Reality.
Award winners have fewer managers, more makers, and way more focus
Let’s start with the way the eight ANA in-house agency award winners are similar to the other respondents in the factbook: they’re about the same size (around 50 FTE) and have similar total number of “core capabilities” (10 for the winners, and 8 for everyone else). They all use a variety of billing methods. Some companies also employ an AOR, others don’t.
Where they differ is in their organizational structure and their total number of projects per year.
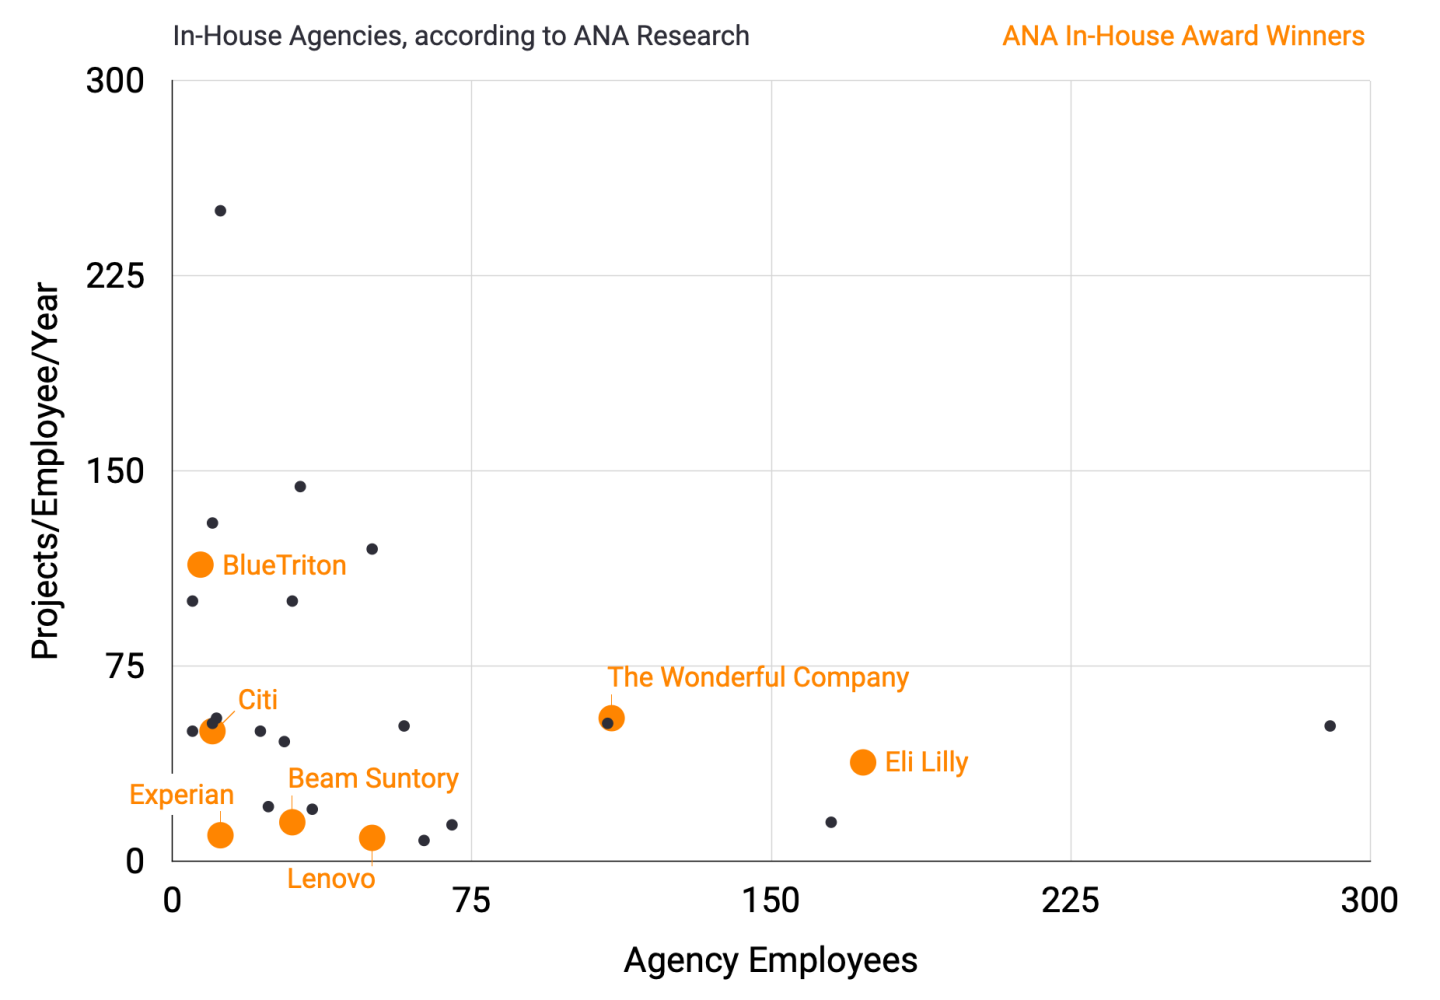
We examined each org chart in the survey and classed jobs as either “maker jobs” or “manager jobs” – jobs where we assume, based on title, signifiers, and our own experience that either spend most of their time making creative outputs, or spend most of their time in meetings about those creative outputs.
On average, the winners displayed a 5:1 ratio of maker talent to manager talent. Everyone else was closer to 1.4:1 – almost one manager for each maker. This could be related to the annual project burden: the average non-award-winning in-house agency completed more than 6,000 projects in 2021, where the average award winner took on just over 2,000. That’s nearly one third the number of projects per year! (Even if we remove outliers above 6,000 projects per year with the assumption that some tracking methodologies oversample the total number of projects, the ratio stays roughly the same, at around 1,600 to 500.)
Our takeaways: focused, maker-heavy teams win.
Hit us up if you’d like our help finding focus, or upskilling your crew in maker skills.